

Know your servers are healthy, before users do
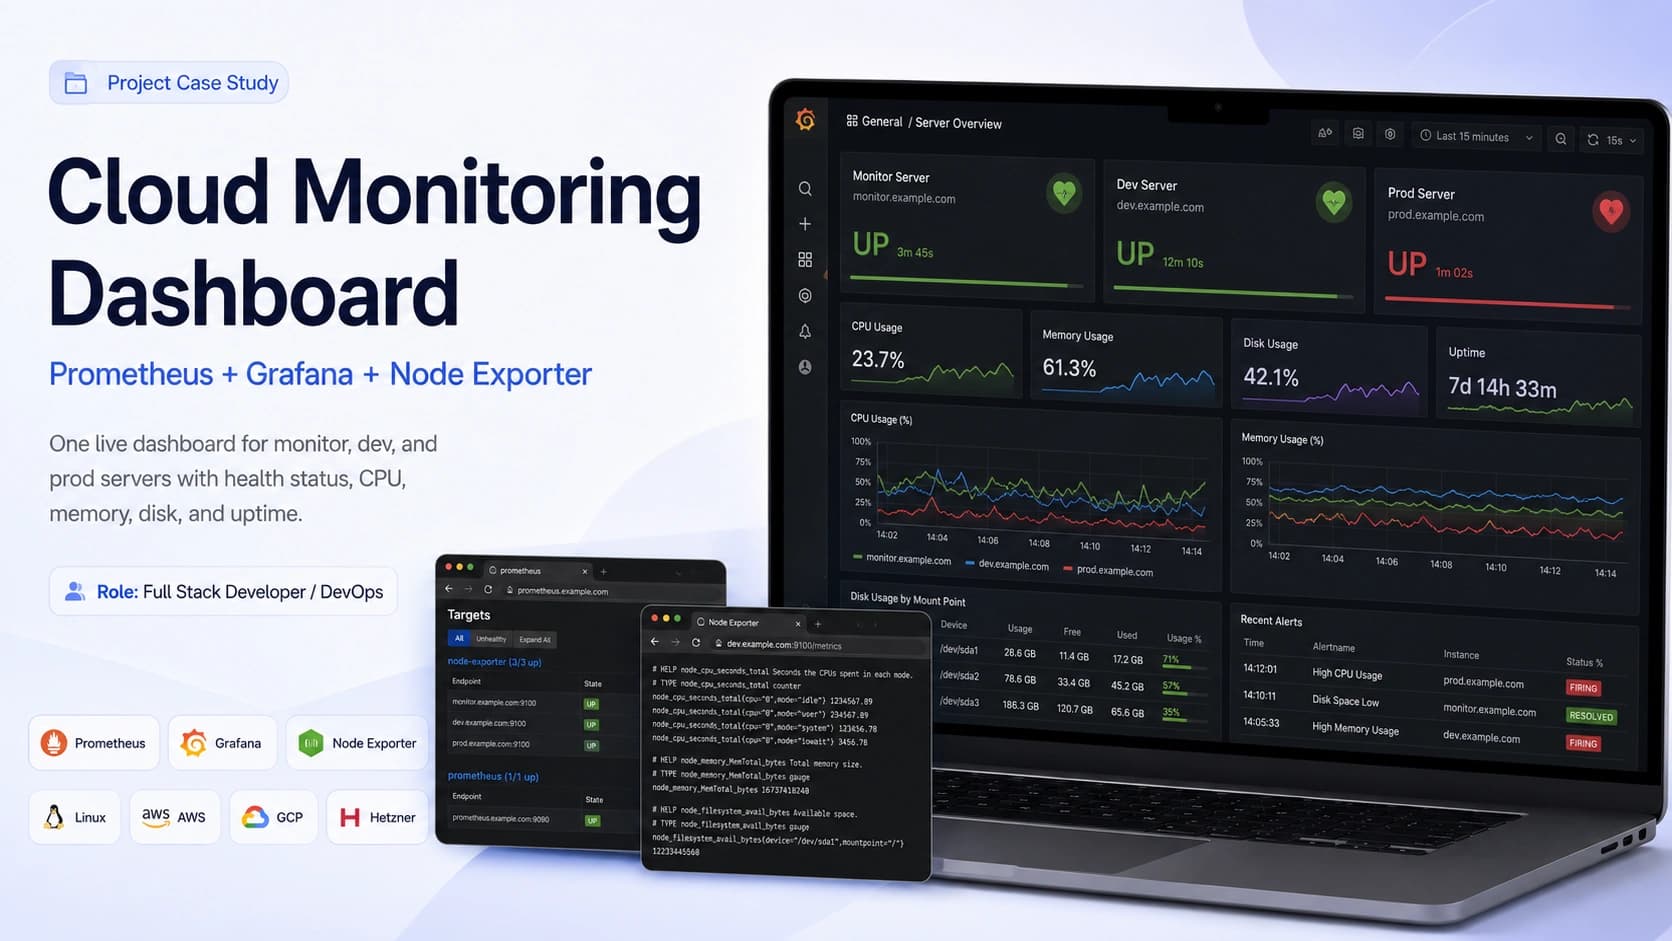
A centralized monitoring stack that collects metrics from dev, prod, and multi-cloud servers through Node Exporter, stores them in Prometheus, and turns them into one live Grafana view with alerting.
- Role
- Full-stack development, DevOps
- Type
- Infrastructure and observability
- Scope
- AWS, GCP, and Hetzner in one view
- Status
- Running in production
- Cloud providers unified
- 3
- Dashboard for the fleet
- 1
- Scrape interval
- 15s
- Alert coverage
- 24/7
Servers fail silently.
Without central monitoring, the first sign of trouble is a customer complaint. A disk fills overnight, a process pins a core, a memory leak creeps up over a week, and none of it surfaces until something breaks in front of a user.
Multi-cloud makes it worse. Each provider has its own console, its own login, and its own way of drawing a graph, so nobody ever sees the whole fleet in one place.
- Failures discovered by users rather than by tooling
- Separate consoles for AWS, GCP, and Hetzner
- No shared history to plan capacity against
One monitor server. The whole fleet in view.
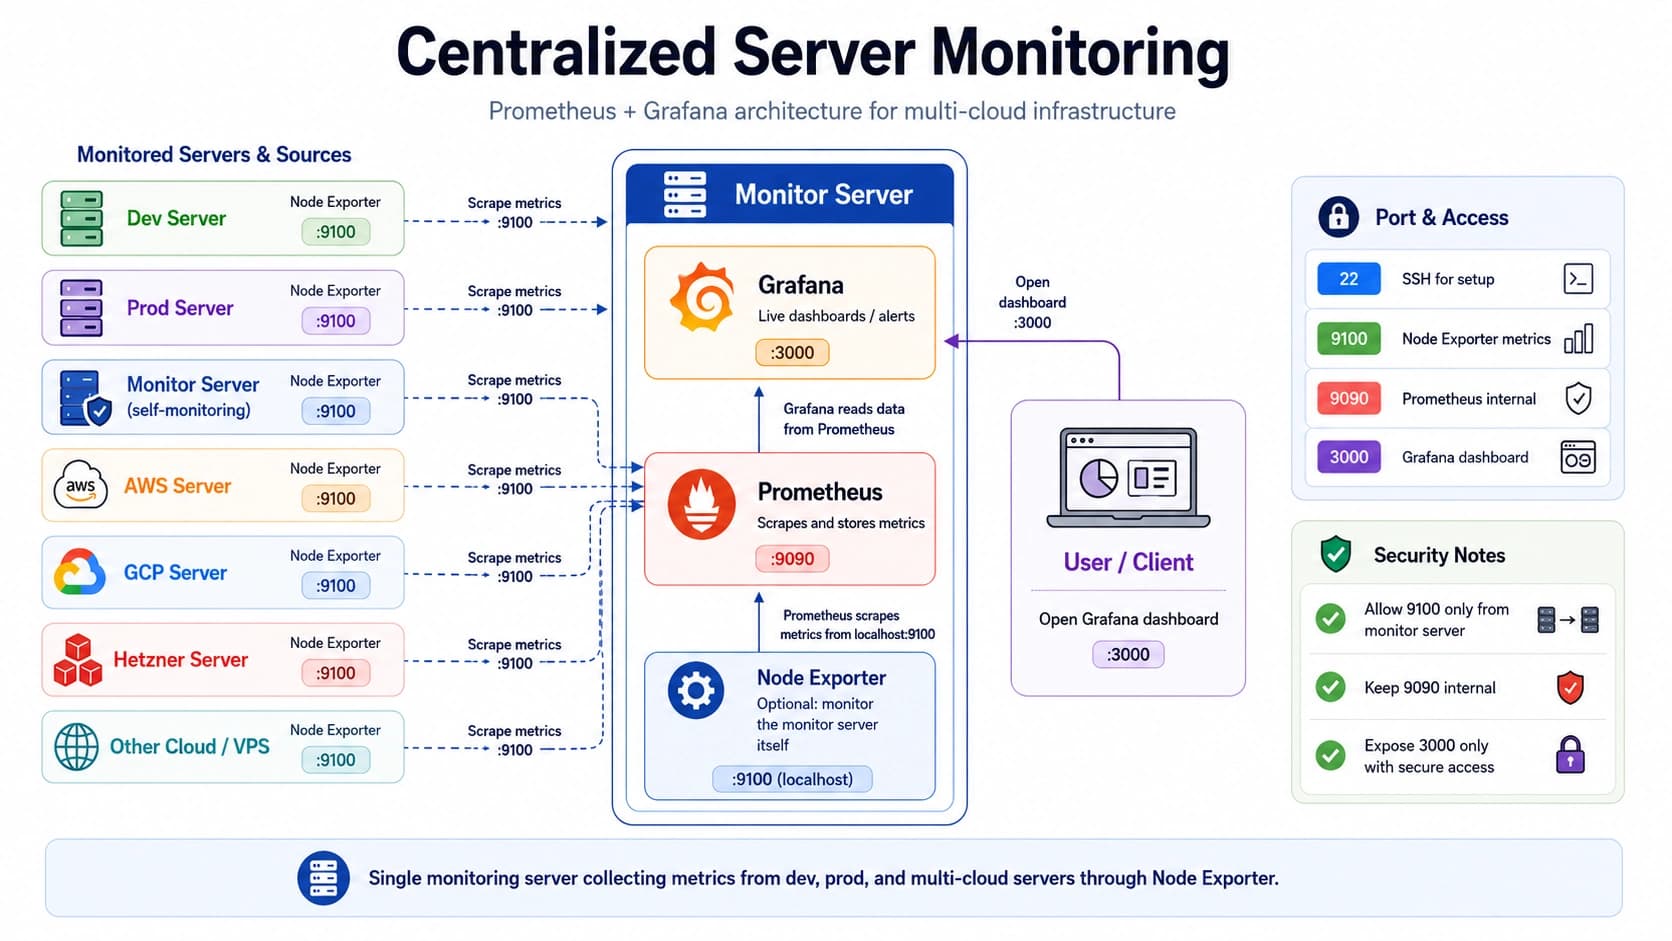
Every machine runs Node Exporter, publishing host metrics on port 9100. A single monitor server runs Prometheus, which scrapes each target on a fixed interval and keeps the time series. Grafana reads from Prometheus and turns that data into dashboards and alerts.
Access is deliberately narrow. Port 9100 accepts connections only from the monitor server, Prometheus on 9090 stays entirely internal, and Grafana on 3000 is the one surface exposed, behind authentication. Expose the dashboard, hide the plumbing.
- Node Exporter on every host, including the monitor server itself
- Prometheus scrapes and stores; Grafana reads and renders
- The whole stack runs in Docker, so it rebuilds identically
Raw metrics are noise. Dashboards are answers.
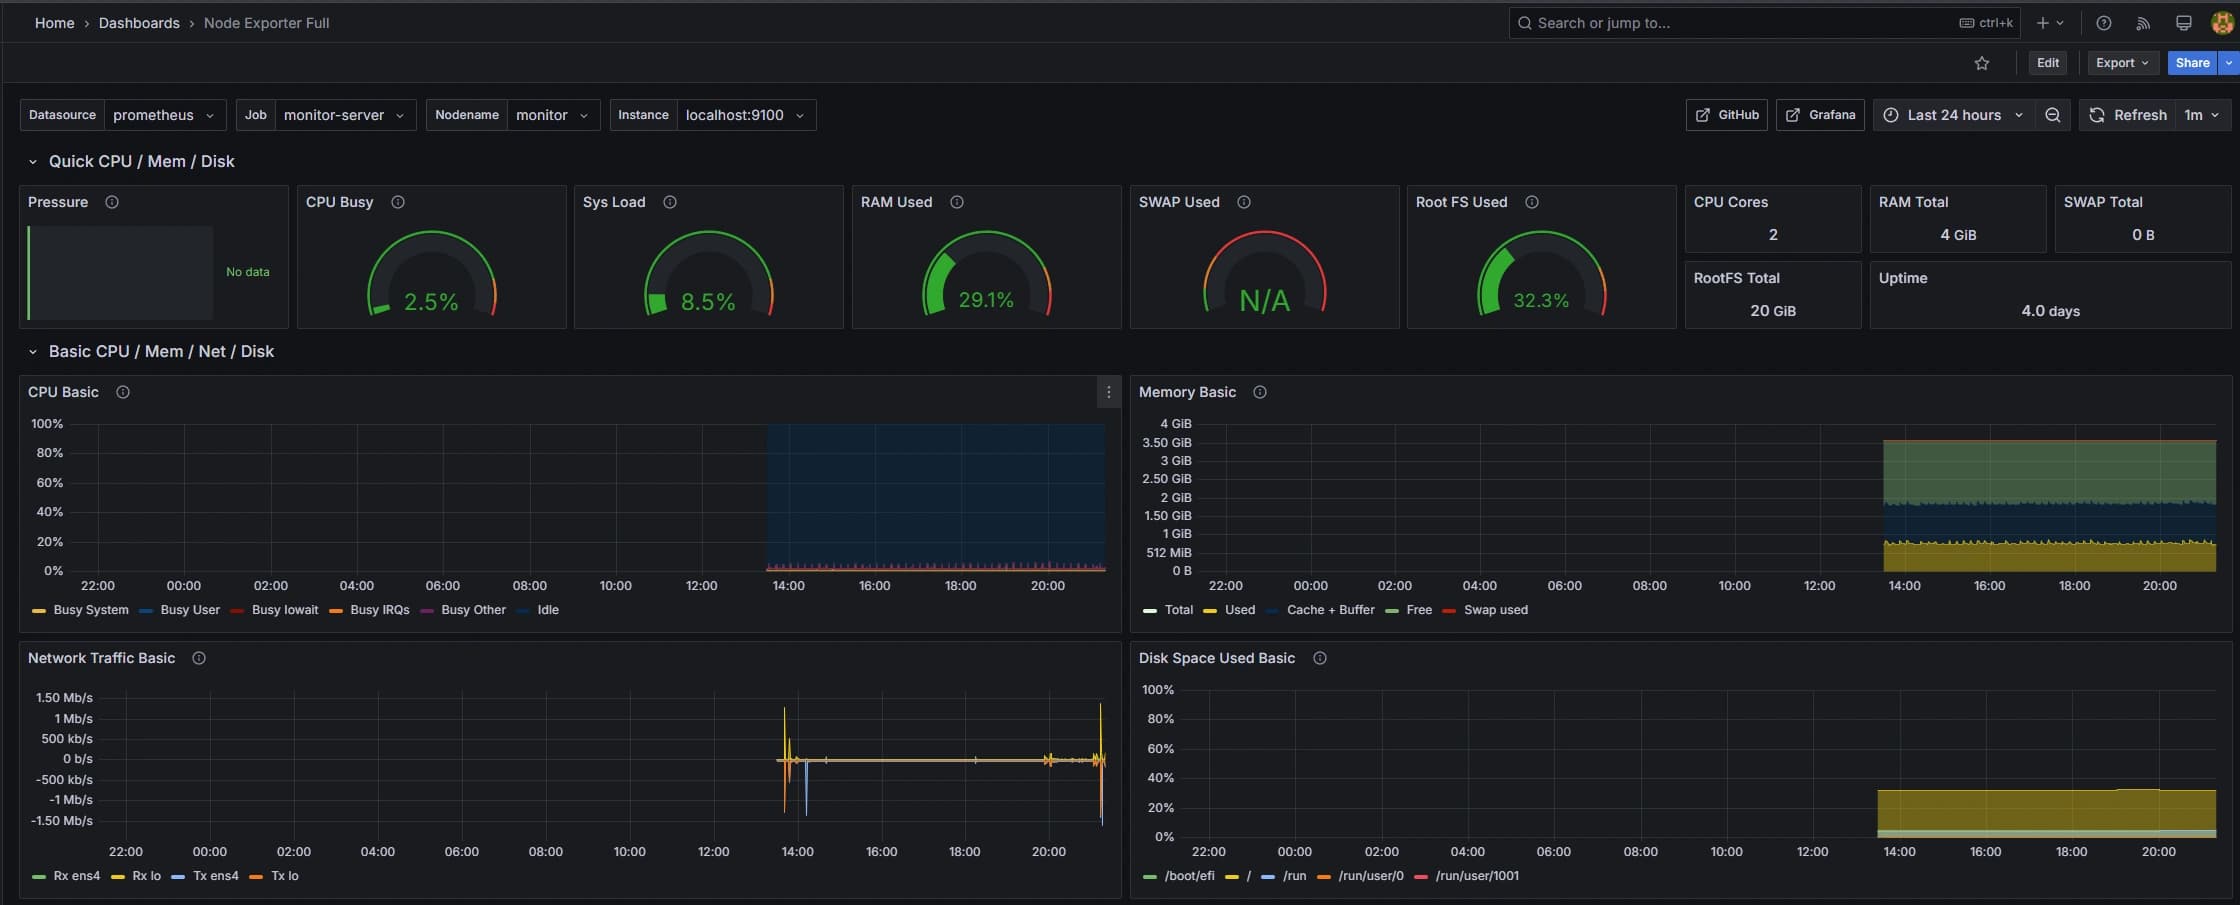
The Node Exporter Full dashboard is the diagnostic view. When something looks wrong, it answers the follow-up questions: which CPU mode is busy, how much of memory is cache rather than used, what the network did at the moment of the spike, which mount point is filling.
It is deliberately dense, because this is the screen you open once you already know there is a problem and need to find it.
A dashboard you have to watch is not monitoring.
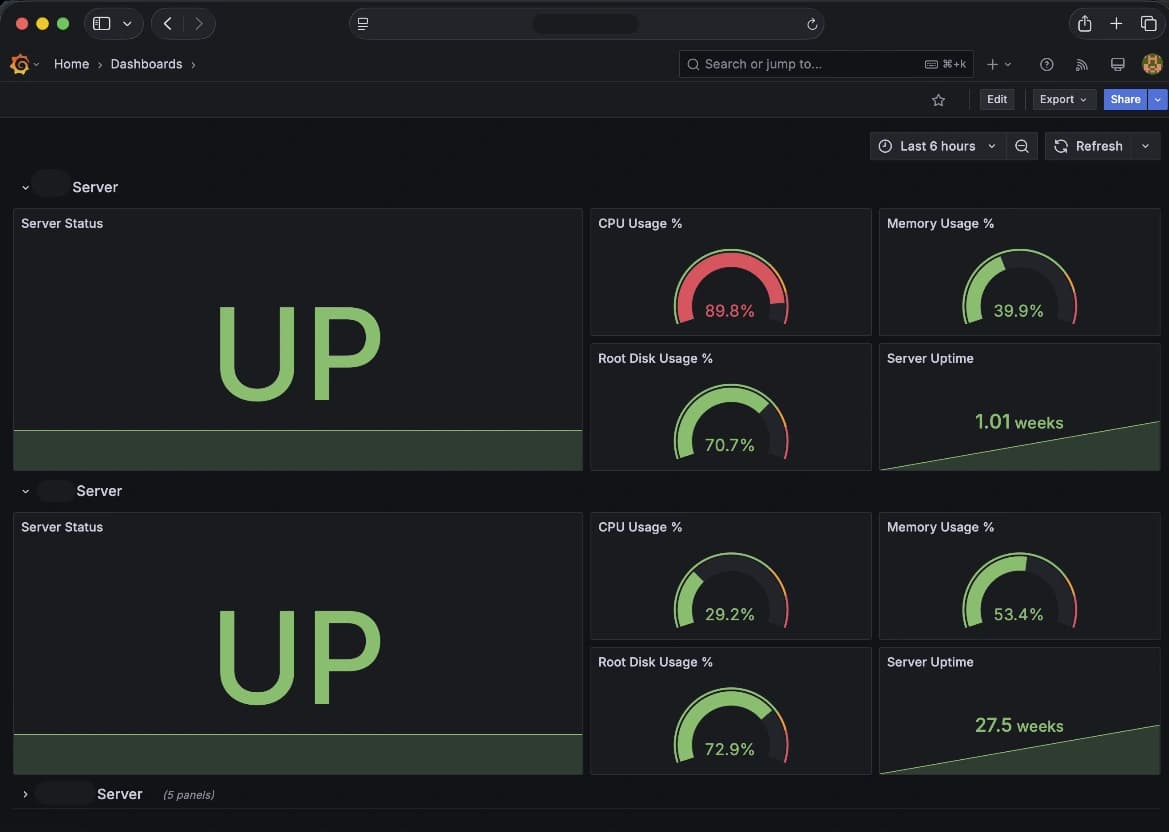
The status board is the opposite of the diagnostic view: large UP and DOWN panels, four gauges, and uptime per server. It is readable from across a room and answers one question, which is whether anything needs attention right now.
Behind it, Prometheus evaluates alert rules against the same time series and fires on high CPU, low disk, and memory pressure. Alerts land in Grafana with clear FIRING and RESOLVED states, so nobody has to keep a tab open to stay informed.
- Threshold rules evaluated continuously against stored metrics
- FIRING and RESOLVED states, so recoveries are visible too
- Self-monitoring, so the monitor server cannot fail unnoticed
One live view for the entire fleet.
Dev, prod, and every cloud server now report into a single dashboard, and the whole stack is reproducible because it ships as Docker containers.
Deploys became boring, which is the point: the graphs stay flat. Incidents get answered from history rather than guesswork, and capacity planning is based on what the machines actually did rather than what someone remembers.
What we built it with
Production-proven tools chosen for performance, developer velocity, and long-term maintainability.
Prometheus
Grafana
- NENode Exporter
Docker
Linux
- AWSAWS
Google Cloud
Hetzner
What shipped
- Single Grafana view covering dev, prod, and three cloud providers
- Node Exporter metrics scraped and retained by Prometheus
- Alert rules for CPU, disk, and memory with resolve notifications
- Metrics ports locked to the monitor server, dashboard behind auth
- Entire stack containerised and reproducible from scratch
- Historical data available for honest capacity planning
Want results like these?
Book a free 30-minute call. We'll scope your project, recommend the right approach, and tell you honestly if we're the right fit.