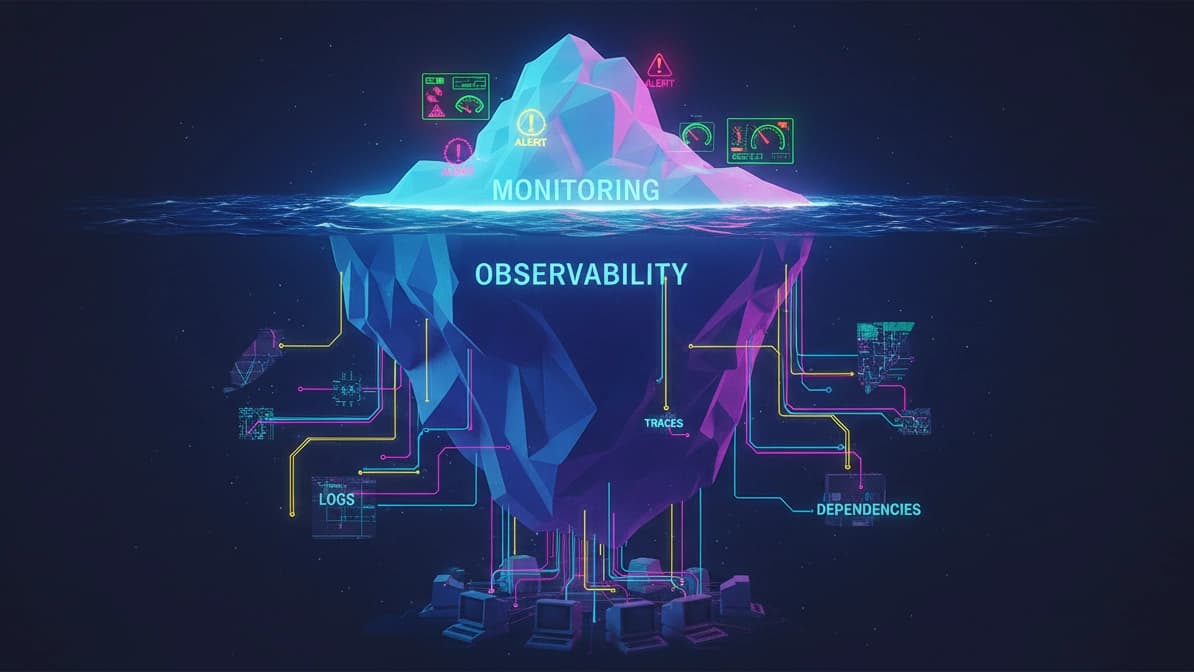

Monitoring & Observability
See everything, catch issues before users do - with centralized logs, metrics dashboards, distributed tracing, and alerting wired to your on-call workflow.
Trusted by companies that ship production software on deadline



Everything you need, nothing you don't
We scope each engagement precisely so you get senior-level work on the capabilities that matter.
Centralized logging
Structured logs aggregated from every service - searchable, retained, and correlated with traces and metrics in one place.
Metrics dashboards
Real-time Grafana or Datadog dashboards for CPU, latency, error rates, and business KPIs - visible to engineering and leadership.
Distributed tracing
End-to-end request flows across microservices - pinpoint slow spans, failed dependencies, and bottlenecks in seconds.
Alerting rules
Threshold and anomaly-based alerts routed to PagerDuty or Slack - with runbooks and escalation policies that reduce noise.
SLO/SLA tracking
Error budgets, burn-rate alerts, and uptime reports - so you know when reliability is at risk before customers complain.
Incident response
On-call rotations, postmortem templates, and status page integration - so outages are resolved fast and learned from.
From blind spots to full observability
We instrument your stack systematically - logs, metrics, and traces first, then alerts and SLOs - so every production issue is diagnosable.
- Learn more
Week 1: Observability audit & design
We map your services, identify monitoring gaps, and design a telemetry architecture with retention, cost, and alert thresholds.
- Learn more
Weeks 2-6: Instrument & dashboard
Log aggregation, metric exporters, and trace propagation ship incrementally - each sprint delivers dashboards you can use immediately.
- Learn more
Launch: Alert, respond & iterate
We configure on-call routing, SLO tracking, and runbooks - plus documentation so your team can tune alerts and respond confidently.

Renting is local, so search had to understand a place and a date range as one question rather than two filters. Mirimera built the marketplace and the software our suppliers run on, and because it is one system underneath, nothing has ever had to be kept in sync.
- Pablo
CEO, Big RentalsObservability stack we deploy
Production-proven monitoring and alerting tools - integrated with your cloud, containers, and on-call workflows.
Datadog
Unified platform for metrics, logs, traces, and APM - with out-of-the-box integrations for cloud and containers.
Grafana
Open-source visualization for metrics dashboards, alerting, and correlation across Prometheus, Loki, and Tempo.
Prometheus
Time-series metrics collection and alerting - the standard for Kubernetes and cloud-native observability.
ELK Stack
Elasticsearch, Logstash, and Kibana for centralized log search, aggregation, and visualization at scale.
PagerDuty
Incident management and on-call scheduling - route alerts to the right engineer with escalation and status updates.
OpenTelemetry
Vendor-neutral instrumentation for traces, metrics, and logs - portable telemetry across any backend.


Ready to see everything in production?
Book a free 30-minute call. We'll audit your observability gaps, recommend the right stack, and outline a realistic timeline.